written by Eugene Han
Over the last year, Circle's USDC, TRON DAO’s USDD, and Terra's UST have deviated from their pegs after a series of on-chain events. Skolem’s data APIs captured activity in each stablecoin’s Curve Finance pools to identify one key pattern: liquidity conditions worsened on Curve prior to significant deviations from each stablecoin’s peg.
Data captured in this post were pulled from Skolem's proprietary data APIs and accessed using our custom Excel add-in/plug-in interface.
Background
Institutions and DeFi participants depend on stablecoins as a means of payment and store of value for transactions and blockchain use cases. Stablecoins enable traders to enter and exit positions without being subject to the volatility of cryptocurrencies like Bitcoin or Ethereum.

Created using Midjourney V4 after prompting: "institutions using stablecoins"
Both centralized stablecoins issued by legal entities (e.g., USDC, USDT, BUSD) and decentralized stablecoins issued by DeFi protocols (e.g., UST, USDD, DAI, FRAX) are pegged to the U.S. dollar through a variety of stabilization mechanisms. This post is not an exhaustive review of how these mechanisms work, but we hope this is helpful to those studying on-chain risk management in DeFi.
USDC Peg Deviation
Stablecoins like USDC, which are fully-backed by U.S. treasuries and cash, carry an important role in decentralized finance for investors. Given USDC’s role as one of the most widely used stablecoins for DeFi, the black swan de-pegging of the stablecoin in early March caught investors by surprise.
Hours after Silicon Valley Bank collapsed on Friday, March 10th, the issuer of the USDC stablecoin, Circle, revealed that it had held $3.3bn of its supply in Silicon Valley Bank, triggering market-wide chaos and fear that USDC was no longer fully backed.
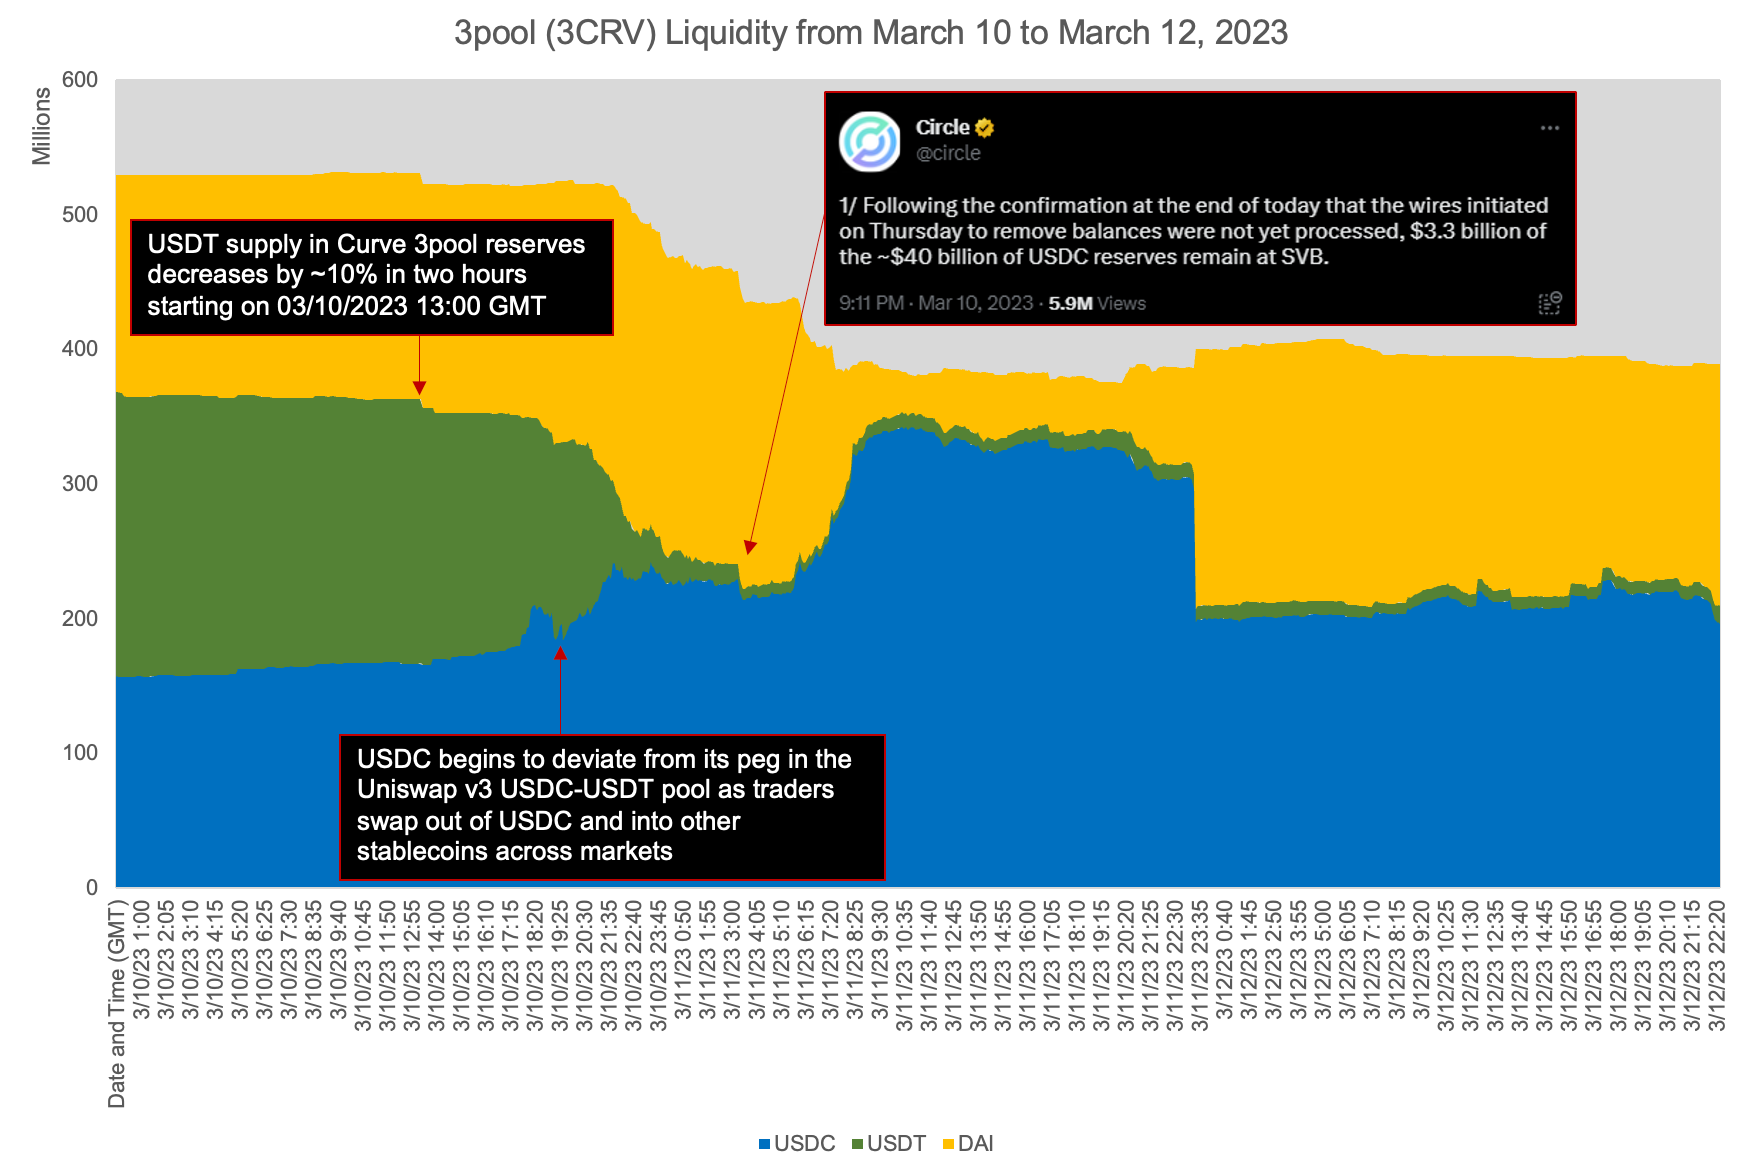
On-chain data reveal that nearly 12 hours prior to the press release from Circle, market participants began to swap USDC for Ethereum and other stablecoins, causing liquidity pool imbalances across USDC pairs such as Curve’s 3pool (3CRV).

3pool liquidity captured using Skolem's Excel add-in and on-chain data APIs
Using Skolem’s on-chain monitoring capabilities, users of our Temporal APIs were able to see in real-time that the USDT supply in Curve 3pool had decreased from 197mm to 181mm starting around 13:00 GMT on March 10th, 2023. Monitoring these liquidity pool balances in real-time, paired with data on inflows, outflows, and price, equipped users with the ability to carefully position themselves for USDC’s black swan de-pegging event.
USDD Peg Deviation
USDD is a stablecoin issued by the TRON DAO Reserve and backed by stablecoins like USDT and USDC and volatile cryptocurrencies like TRX and BTC. In early November 2022, USDD deviated from its peg as the fallout of FTX shook investor confidence across markets.
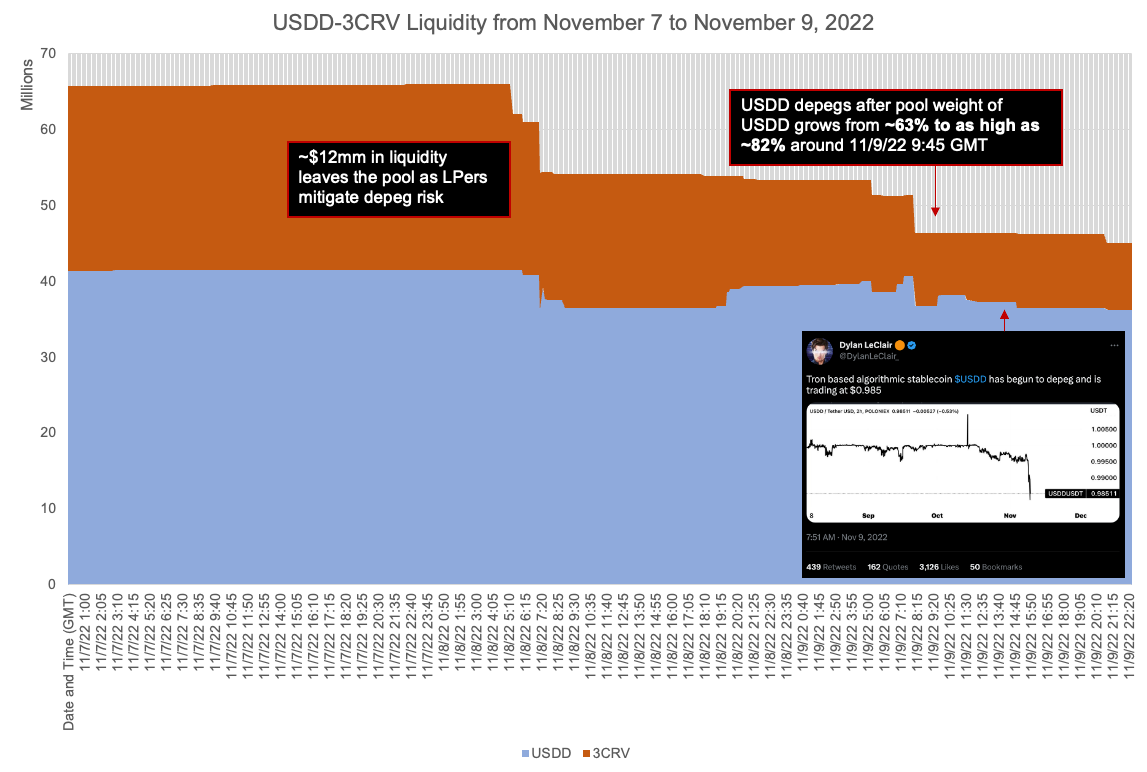
Curve’s USDD pool signaled worsening liquidity conditions as the USDD-3CRV grew increasingly imbalanced, with USDD accounting for more than 80% of the USDD-3CRV pool by November 9th. Skolem’s Temporal APIs monitoring the USDD-3CRV pool were able to identify early signs of USDD sell pressure nearly 24 hours in advance of USDD’s more meaningful imbalance in the pool and deviation from its peg.

USDD-3CRV liquidity captured using Skolem's Excel add-in and on-chain data APIs
Similar to USDC's depegging, on-chain investigators who were monitoring USDD's liquidity would have noticed before Twitter and CoinDesk caught on with the masses.
UST Peg Deviation
For those unfamiliar with Terra’s UST stablecoin, UST was a decentralized, algorithmic stablecoin that was anchored to $1.00 through on-chain mint and burn mechanisms in which a set of smart contracts set the condition that 1 UST was worth $1.00 of LUNA, a volatile token. Unlike USDC, UST was not backed by real cash and U.S. treasuries to maintain its link to the dollar.
By early May 2022, UST had a market capitalization surpassing $18bn, emerging as one of the largest stablecoins behind USDT and USDC.
UST’s peg was maintained through arbitrage between UST and LUNA:
[Mint] If the peg of UST is above $1.00, an arbitrageur could purchase LUNA from the open market and swap $1.00 of LUNA for 1 UST via Terra's smart contracts by minting new UST, expanding the supply of UST.
- The peg is returned to $1.00 as the arbitrageur sells this newly minted UST in the open market and profits from any deviance above $1.00 per 1 UST.
[Burn] If the peg of UST is below $1.00, an arbitrageur could purchase discounted UST from the open market and swap 1 UST for $1.00 of LUNA via Terra's smart contracts by burning 1 UST for LUNA, contracting the supply of UST.
- Peg is returned to $1.00 as the arbitrageur purchases UST in the open market and profits from any deviance below $1.00 per 1 UST.
This mechanism and stablecoin design began to gain criticism from market observers and concerns grew around UST’s ability to maintain its peg. Saturday, May 7th, 2022 was an important day for UST’s peg.
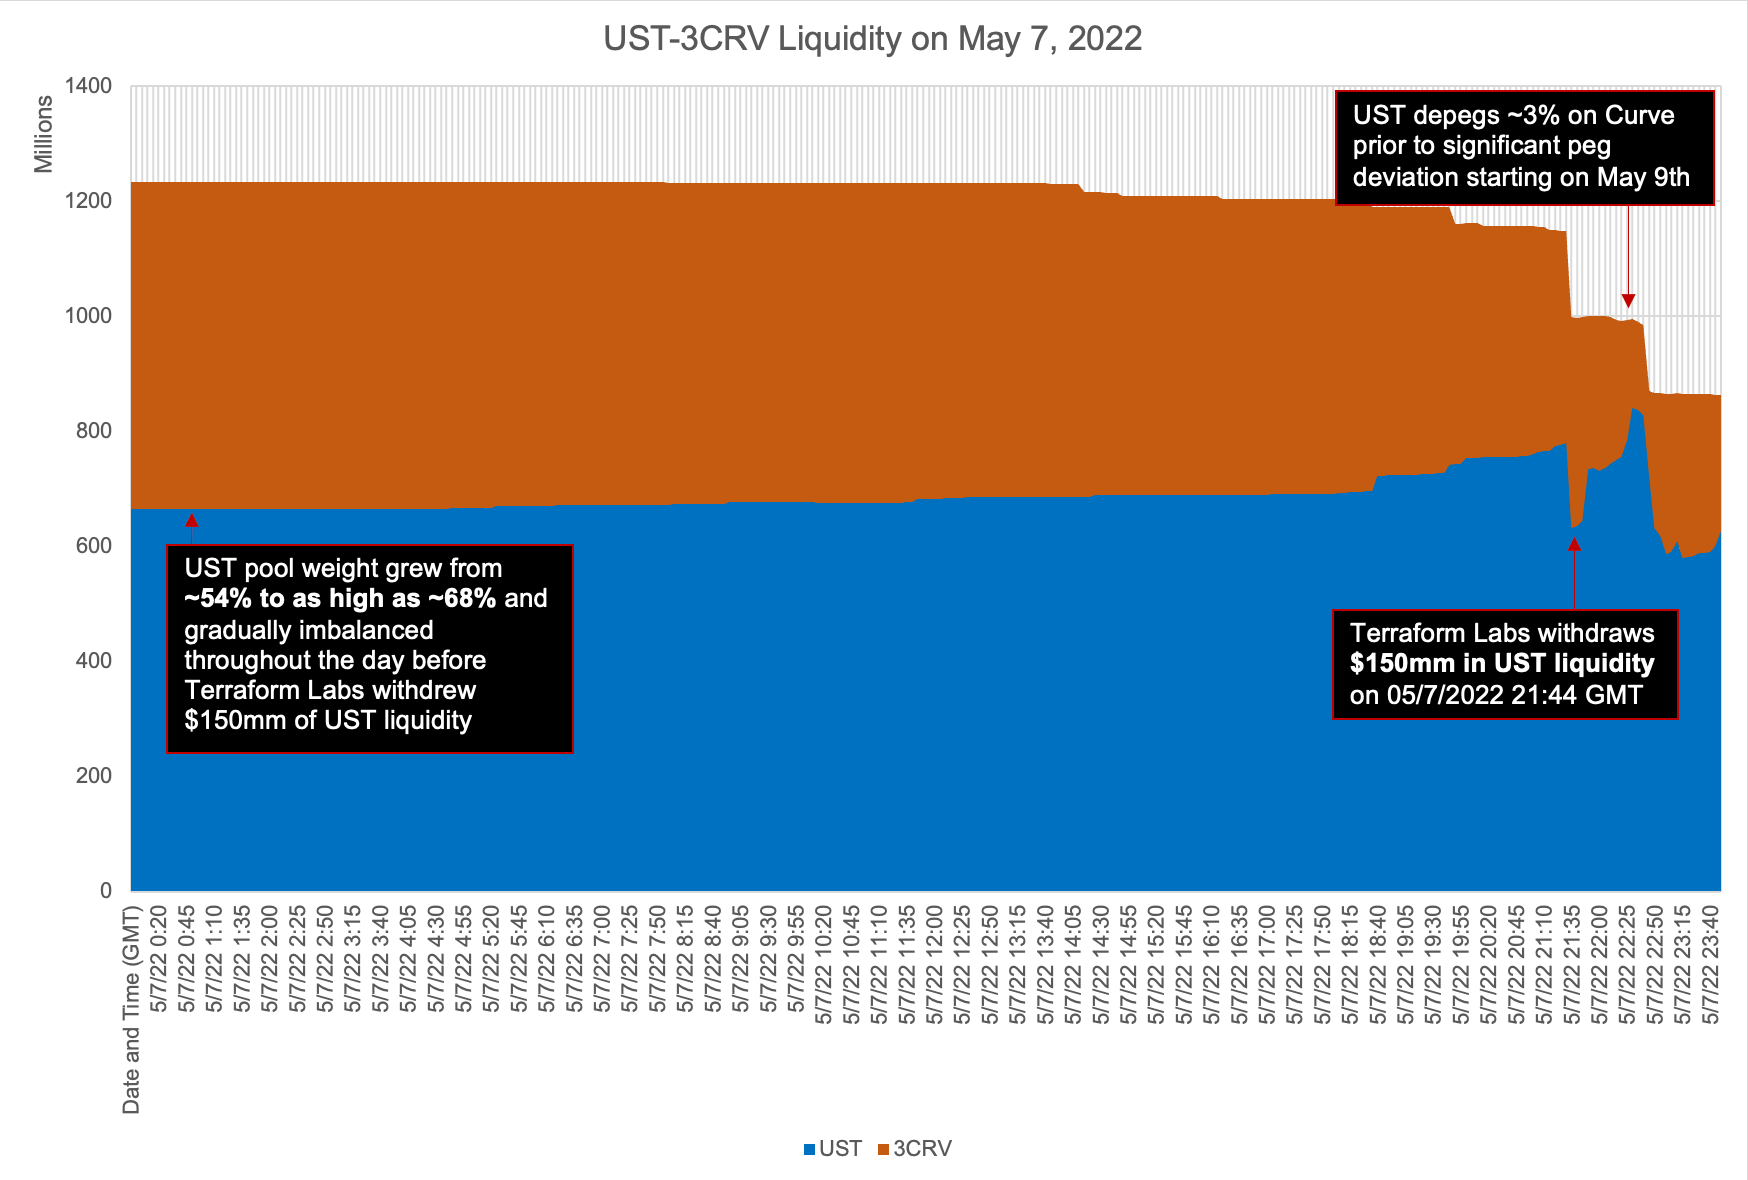
Terraform Labs withdrew $150mm in UST liquidity from the UST-3CRV pool on Curve, kicking off a sequence of liquidity degrading activities in the most liquid market for UST on any decentralized exchange.

UST-3CRV liquidity captured using Skolem's Excel add-in and on-chain data APIs
The UST-3CRV pool had gradually grown imbalanced throughout the day, but the sudden withdrawal of liquidity and swaps from UST to 3CRV created deviations from the peg. These initial deviations began to draw attention from market observers, bringing in more scrutiny and legitimate concerns around the stablecoin’s “stability.” In order to stay ahead of market anomalies and black swan events, it is critical to monitor relevant liquidity pools and on-chain money movements for on-chain positions.
Final Thoughts
Skolem's data APIs can support your on-chain risk management by providing high fidelity data streams prior to significant liquidity events and broader media attention to market events.
Across all three depegging events with USDC, USDD, and UST, users of Skolem's data were able to capture worsening liquidity signals, at minimum, 12 hours ahead of major deviations. Particularly with Terra's UST depegging, users of Skolem's APIs would have been able to see swaps of UST for other stablecoins and withdrawals of UST liquidity leaving the UST-3CRV pool two days ahead of the significant May 9th depegging. Users of Skolem can stay ahead of the masses by monitoring liquidity events and understanding market behaviors using Skolem's on-chain data services.
If you're interested in learning more about Skolem's offering, visit our website at skolem.com or email our team at sales@skolem.com.

